Understanding Candlesticks: Reading the Language of the Market
How I Learned to Hear the Market Speak Back

When I first started trading, I thought success was about finding the perfect indicator. My charts were cluttered with every line and tool I could find, and I kept waiting for the magic combo to unlock consistent wins. But the real shift came when I stripped my screen down and focused on candlesticks.
Candlesticks are the purest form of price action. They’re not predictions, they’re receipts. They show what buyers and sellers already did, and in that history, you can hear the rhythm of what’s likely to come next.
The Anatomy of a Candle
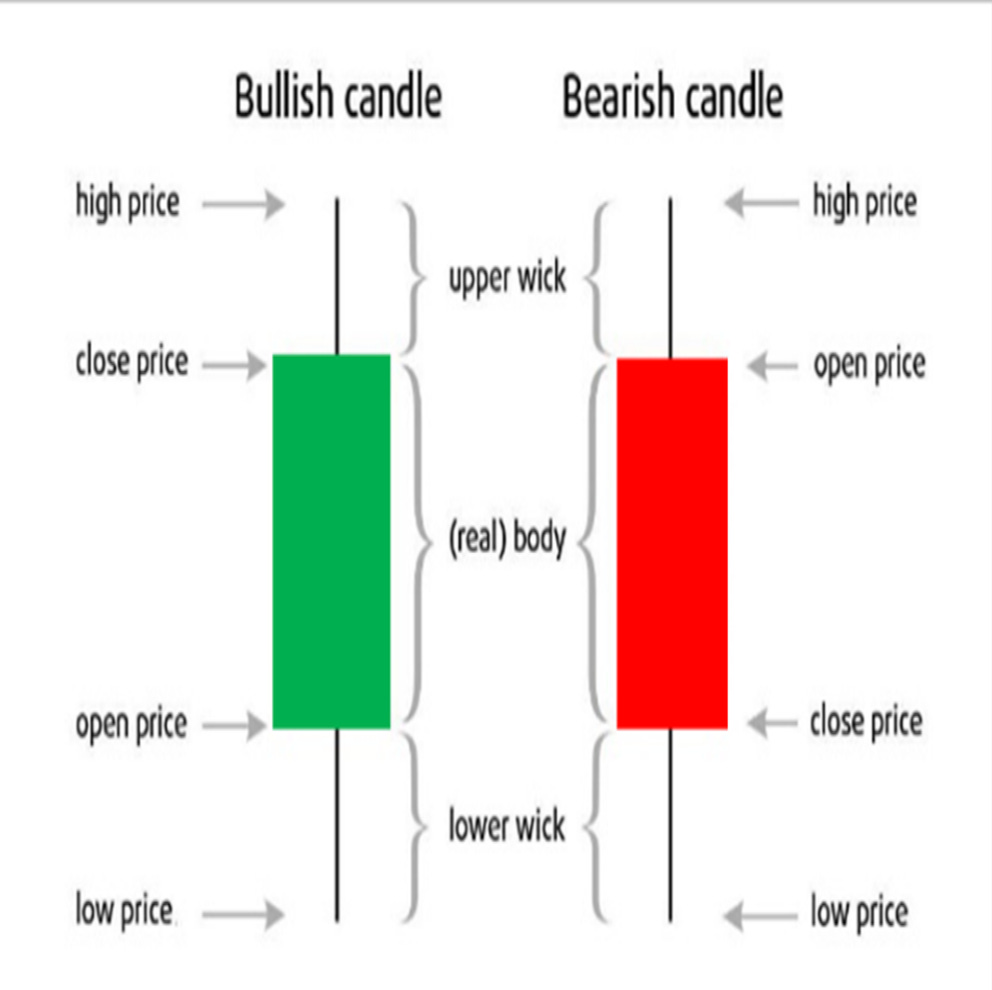
The Body: The meat of the move, this is the fight between the open and the close. A strong, full body means commitment.
The Wick (or Shadow): The extremes. They tell you how far the market tried to go before being pulled back.
The Color: If Green closed higher than the open, then bulls won the fight over price. If Red closed lower, then bears won.
The Language of Candles
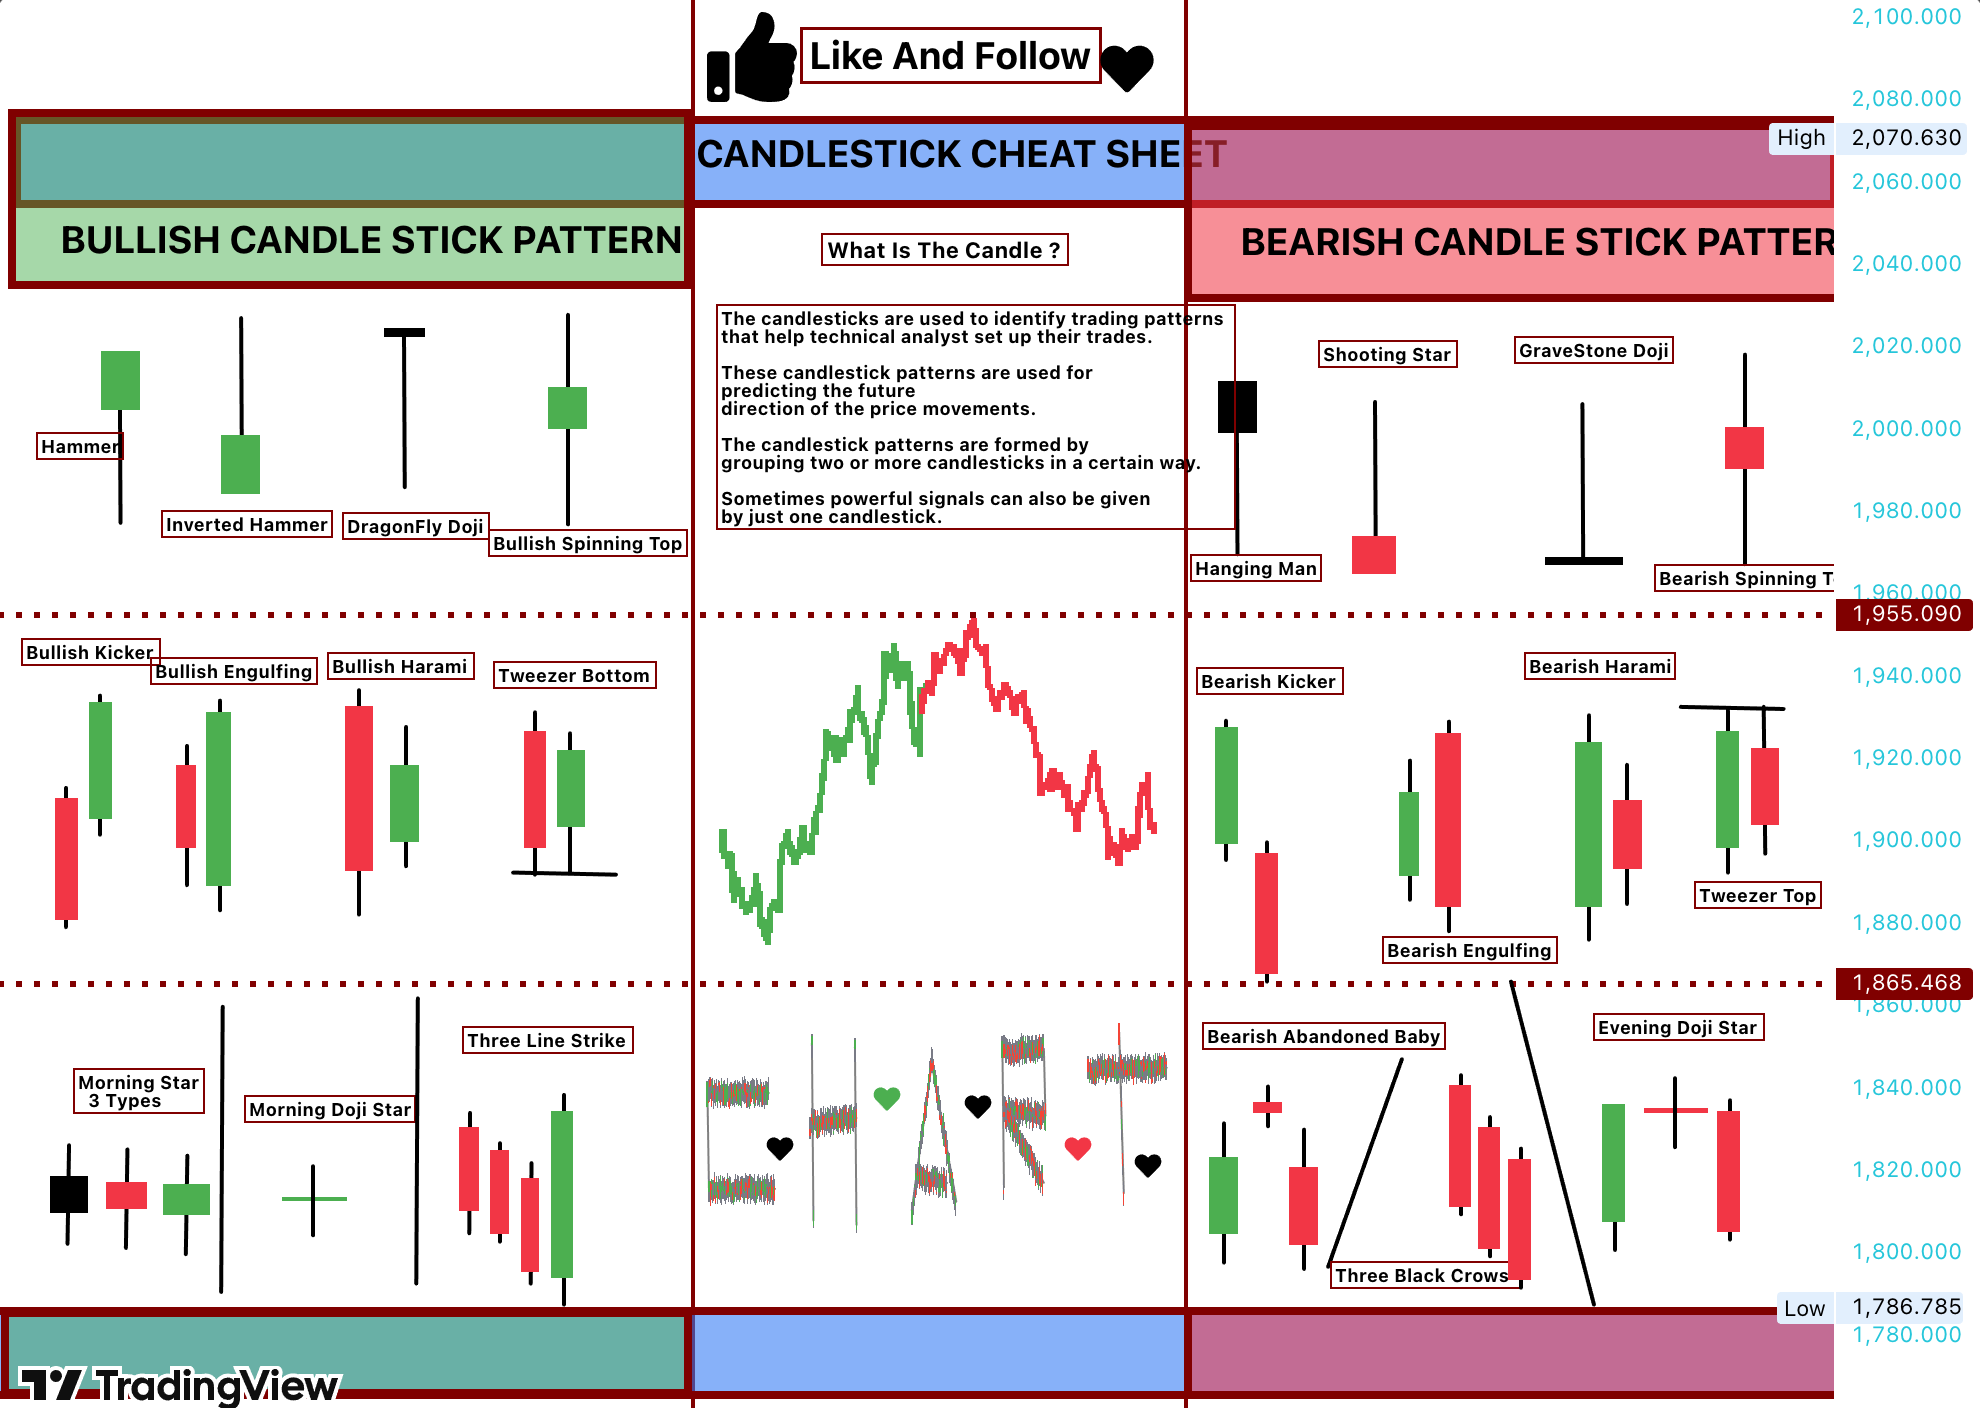
Candlesticks aren’t all the same; each one forms a different shape, and those shapes are the footprints of market movers making decisions in real time. A thin-bodied doji shows hesitation, where buyers and sellers wrestled but neither side could close with strength. A hammer reveals sellers tried to push the price down, only for buyers to step in and reclaim control before the close, which typically hints at a reversal from a bottom. A shooting star flips that script: buyers tried to climb, but sellers shut it down, leaving a long wick above as a trail of rejection. And then there are engulfing candles, where one side completely overpowers the last, announcing a clear shift in momentum.
Doji → A moment of indecision. Buyers and sellers locked in a stalemate.
Hammer → Buyers refusing to let price drop further; often a turning point near support.
Shooting Star → Sellers shutting down bullish energy, often near resistance.
Engulfing Candles → Momentum shift. One side overpowers the other and takes control.
Each candle is more than a shape; it’s a signal of conviction, indecision, or exhaustion, letting us read the psychology of the market without a word being spoken.
Engulfing Candles: When the Market Raises Its Voice
An engulfing candle forms when a new candle completely covers (or “engulfs”) the previous one’s body. It’s the market saying, forget what just happened; this is where we’re headed.
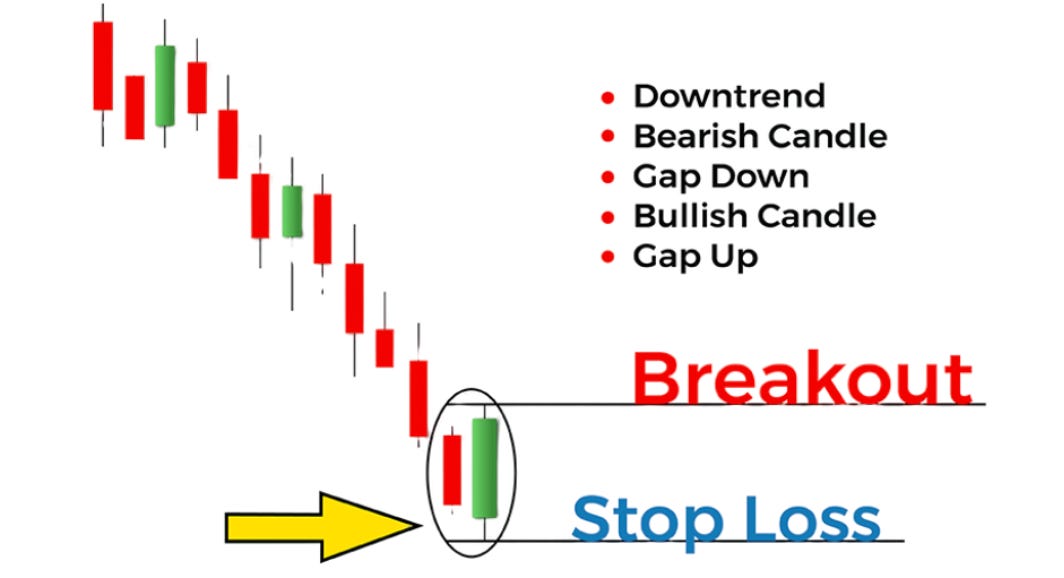
Bullish Engulfing: A small red candle followed by a big green candle that swallows it whole. Buyers just flexed, showing they’re taking control. When this happens at a support level or after a downtrend, it can mark the start of a new push upward.
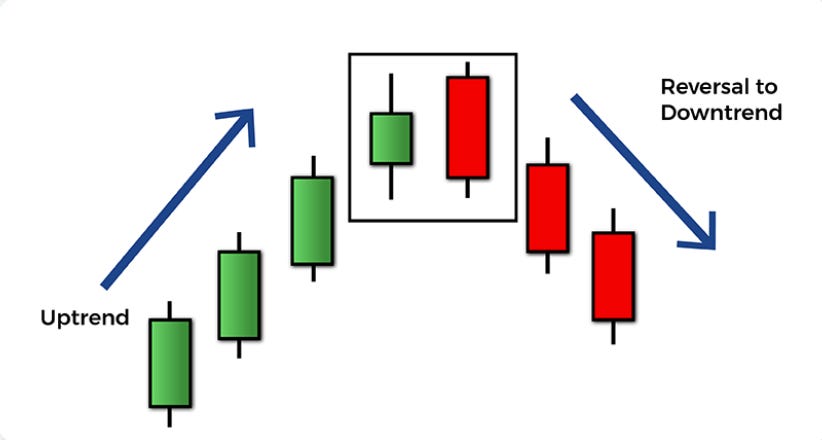
Bearish Engulfing: A small green candle followed by a big red candle that wipes it out. Sellers just took the wheel. At resistance or after an uptrend, it can be the beginning of a downward move
The power of engulfing candles is in context. They show key zones; they’re like the market raising its hand and saying, Pay attention.
How I Use Them in Practice
I watch for engulfing patterns at the levels I’ve already marked: support, resistance, VWAP zones. If I see a bullish engulfing candle at support, that’s confirmation. If I see a bearish engulfing candle at resistance, I start planning an exit or reversal trade.
This doesn’t mean every engulfing candle is gospel. False signals exist. But journaling them and noting the context sharpened my eye. The more I tracked, the more I started to hear the difference between noise and conviction.
Self-Mastery Through Candlestick Reading
Trading isn’t just numbers; it’s patience, trust, and discipline. Engulfing candles taught me to slow down. Instead of chasing, I wait. I let the market show me when the balance of power shifts. That same patience carries into life: waiting for clarity, not forcing it, and acting when the signal is undeniable.
When I go against my knowledge, the indicators, the candle patterns in the chart ANNND I take a trade based on my unsupported bias, fear of missing my move, or chasing a big move, two things will happen:
The trade typically goes against me, and I lose.
That loss creates an emotional reaction: anger, irritation, frustration, sadness, etc.
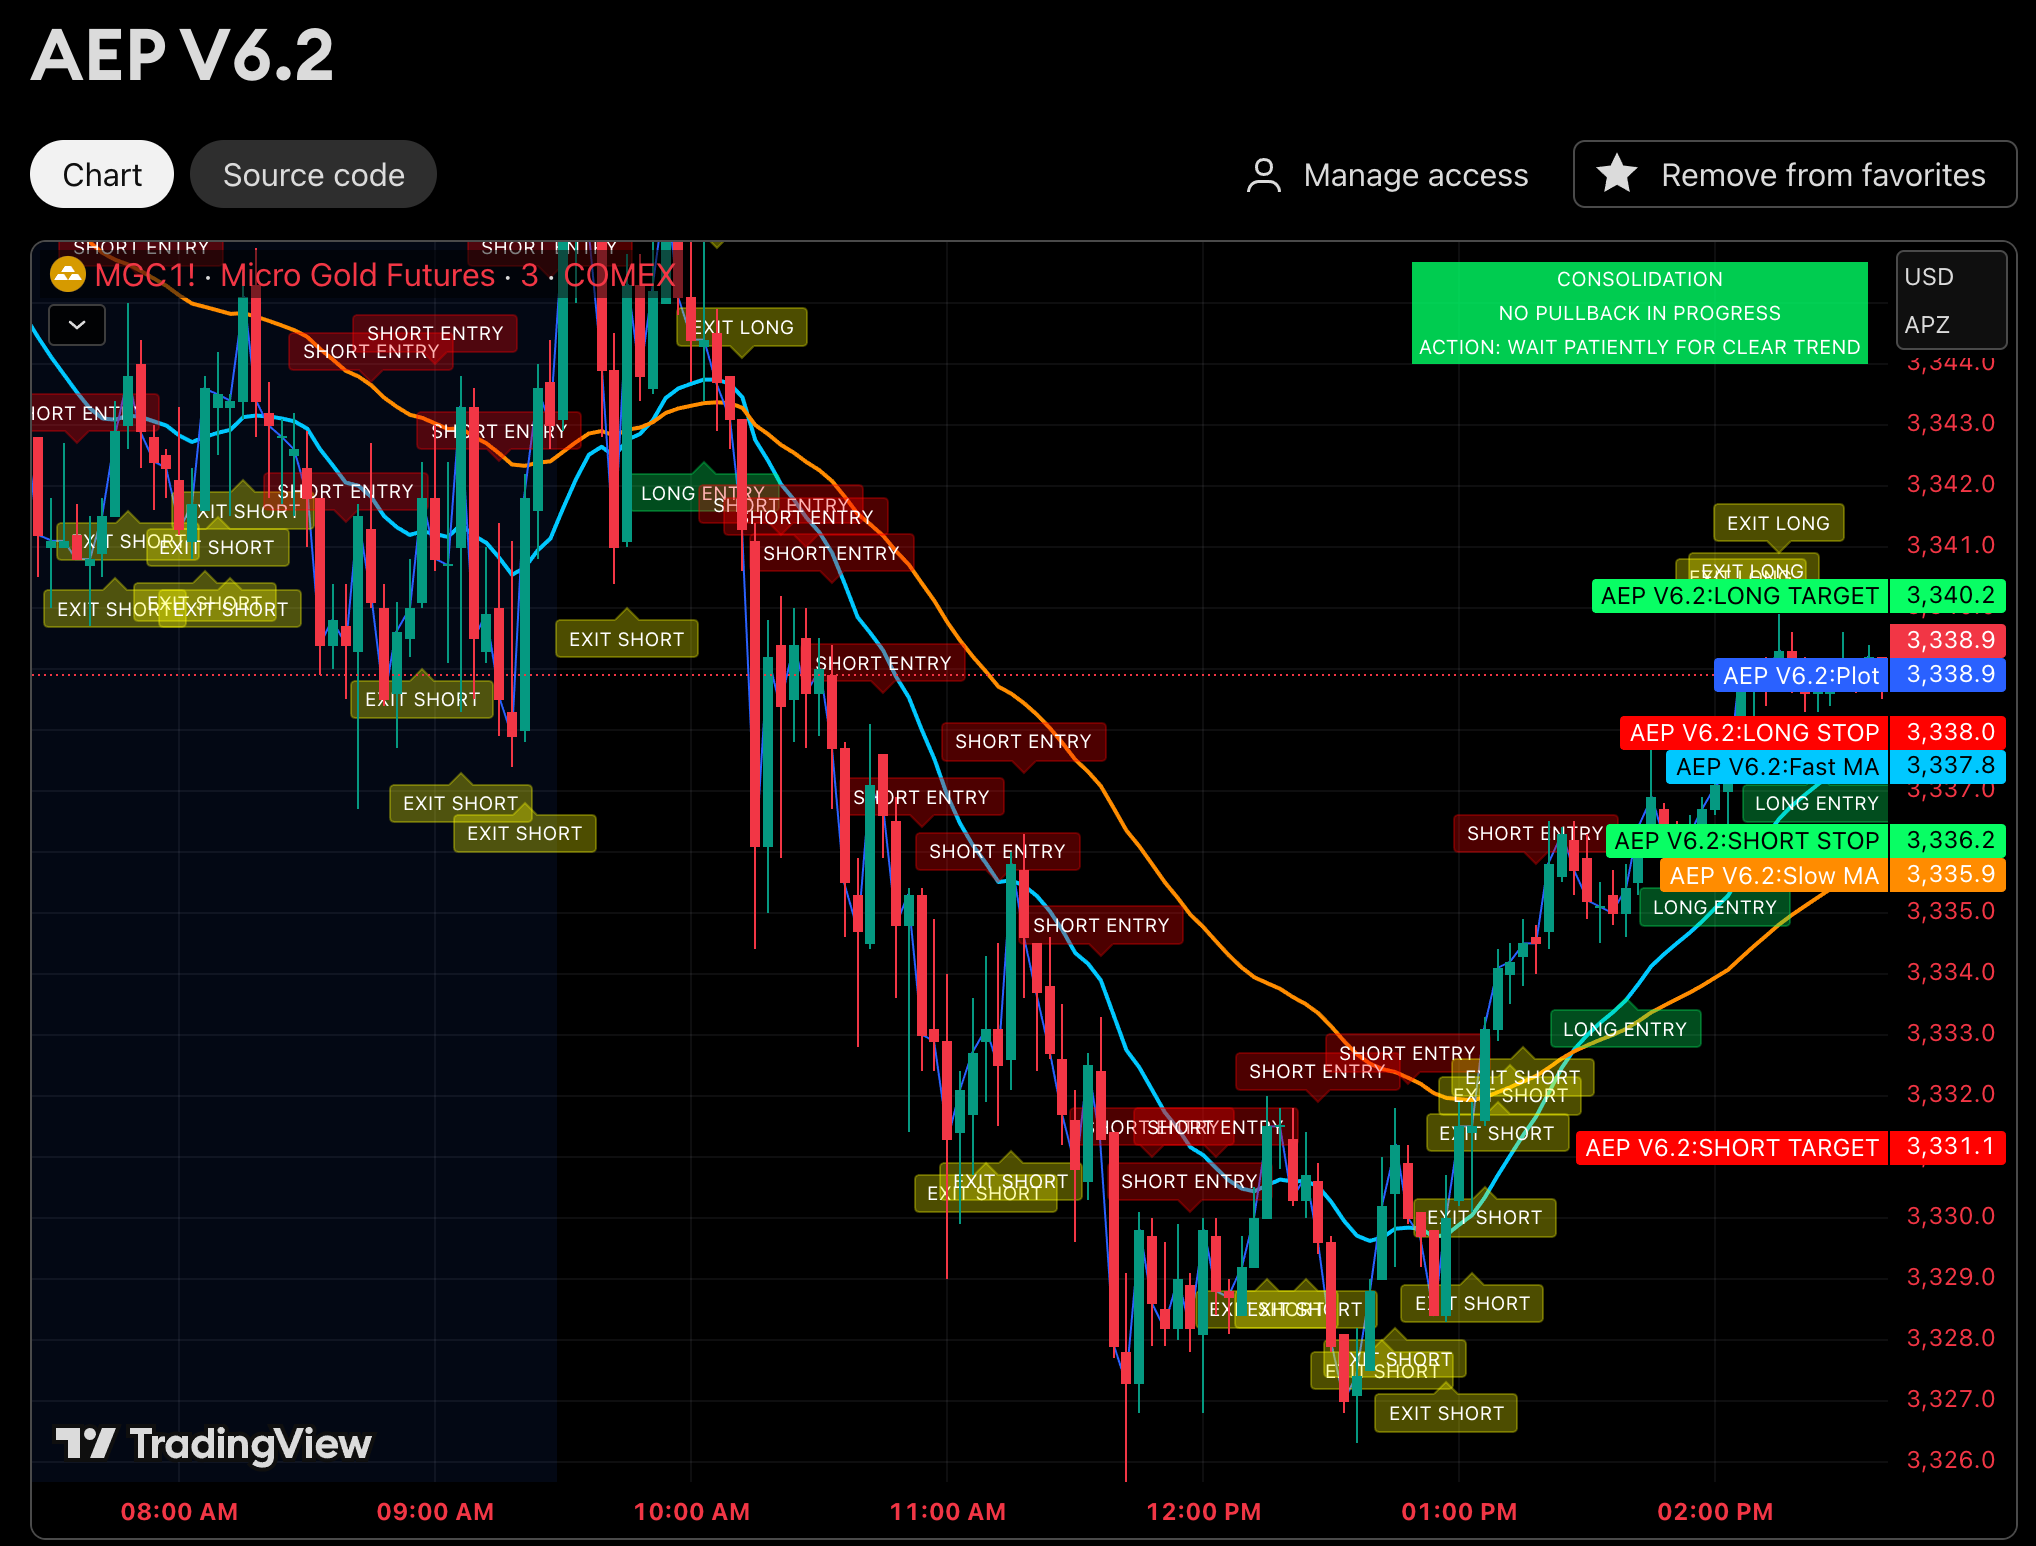
After creating the AEP, which clearly tells you when to enter a trade, when to hold, and when to exit a trade, I realized that my actions of going against the entire system ran deeper than just in trading. They mirrored deeper patterns in my life. Every loss became an opportunity to evaluate the emotions, actions, and parallels to other choices I’d made. The AEP put me through a rigorous self-mastery process that shaped not just my finances, but my spiritual growth.
If you choose to use it, I hope it helps you the same way.
Closing Thought
Every candle is a sentence in the market’s ongoing conversation. Some are whispers of hesitation, some are sighs of exhaustion. But an engulfing candle? That’s the market raising its voice. Learn to hear it, and you’ll stop second-guessing and you’ll start translating fluently.
Want to practice candle reading? Search for these gameified apps from the app store:
To access the AEP Indicator to enhance your trading skills, subscribe to this substack, send me a message to request to be added to the private indicator.